


Bus Terminal Revisited: Interactive Tool Edition
Building a tool to analyse coaches' performance
At the end of my last piece, on mapping and clustering coaches based on their style of play, I promised to soon return with fresh supplies of cluttered and colourful charts. At the time, I thought I had everything I needed to write up this second part over a couple of days, but it turns out I am an absolute sucker for that mostly-pain-negligible-gain, faux-productive kind of tinkering whose rabbit holes are so easy to fall into, but so difficult to clamber back out of. With that in mind, I’m sure I’ll be revisiting and revising this all at some point, armed with more and better data. But I’d like to think what follows is at the very least a decent starting point in creating an interactive tool to evaluate coaches and their level of performance. Feel free to skip the rest of this and get straight to fiddling around with that tool - link !! - if you don’t currently have the appetite to read a fair chunk of words on my methodology, but if you can stomach it I’m pretty sure it’ll help to patiently stick with me.
Last time, we refrained from looking at things like goals and other metrics related to the quality of a team’s output as we were more interested in learning about the different approaches coaches have to playing the game rather than simply how successful they are. But now that we’ve found and defined those eight broad clusters of playing styles, it’s time to bring the goals back into the mix.
Sort of. I know many people will already be familiar with the concept, but for those who aren’t, I should quickly explain the term ‘Expected Goals’ before we go any further.
Expected Goals (xG for short) is essentially just a weighted version of a team’s shot count. In the same way one might look at the number of attempts ‘on target’ to seek a better understanding of a team’s performance than their raw shots total alone, xG assigns each shot a number between 0 and 1 to indicate the probability of it resulting in a goal, and therefore paints a more accurate picture of the quality of said performance.
Every data provider has its own methods of measuring this, but the general principle remains the same: based on variables such as the location and angle the shot is taken from, how many players are positioned between the ball and the goal, whether the ball arrives to the shooter in the air or on the ground and so on, a huge database is called upon to figure out how often shots taken in comparable circumstances have historically resulted in a goal. An attempt from 40 yards out with half the opposing team stood in the way, for example, might be given an xG of 0.01, while a shot taken in the six-yard box with only the keeper to beat would result in an xG of much higher value - “he/she should really be hitting the back of the net from there”, in other words.
However, while xG can give some insight into how well each team played in a single match, the statistic is at its most useful when looking at longer term trends: xG is a far better predictor of a team’s future goal tally than the number of actual goals they’ve previously scored up to that point.
Bringing it back to the topic at hand, the specific reason I’m using xG instead of actual goals is because many of the coaches involved had relatively short tenures at clubs, meaning their goal tally didn’t really have time to ‘even out’ and fall in line with the quality of their teams’ performances. It levels the playing field somewhat, in that respect. One last caveat to make is that I decided to use non-penalty xG - excluding penalties, which have an xG of around 0.7, gives a better indication of the quality of chances a team are consistently able to produce on their own terms, in my eyes, and so seemed more appropriate. And, as ever, all figures are presented on a ‘per 90’ basis, i.e. a coach’s average xG per game, rather than the total over the course of the season - again due to the different lengths of tenures.
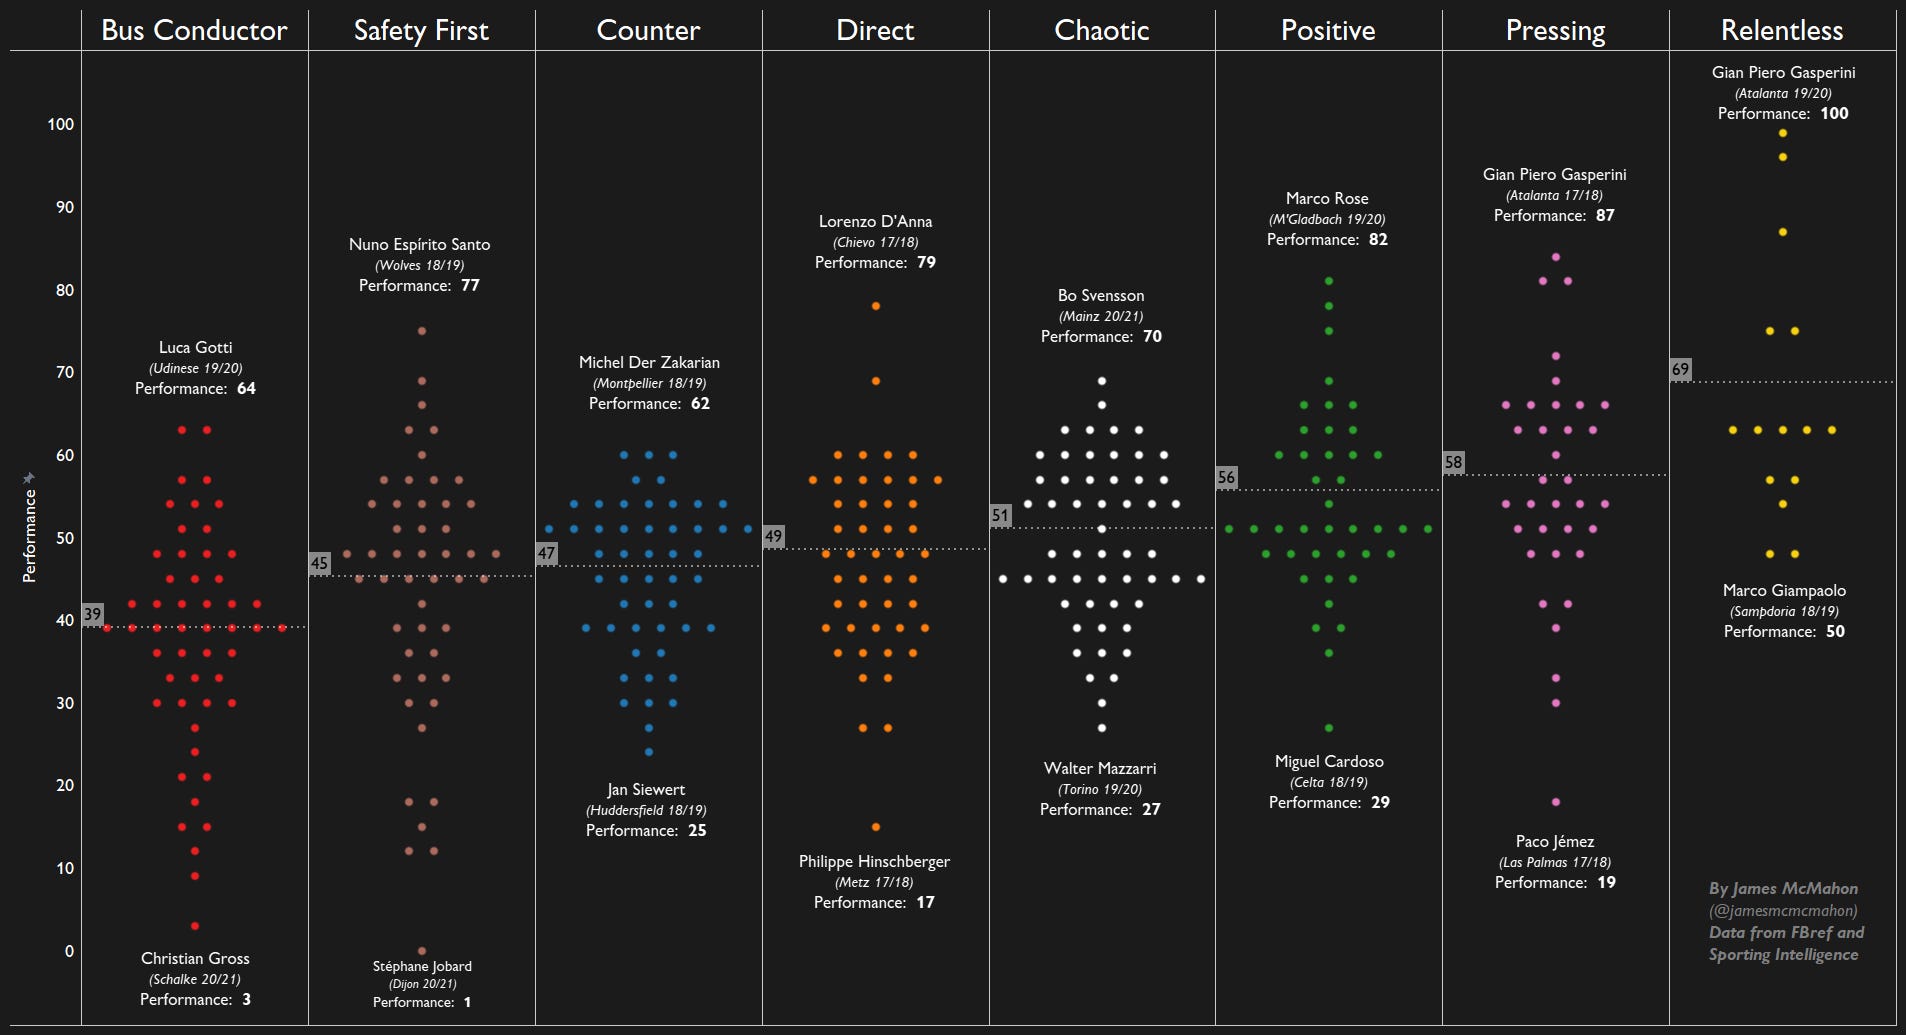
Definitions and disclaimers dealt with, then, let’s look at how well coaches in each cluster performed based on their Expected Goal Difference (‘xG for’ minus ‘xG against’) per 90. The clusters are arranged by lowest to highest average from left to right, with each dot representing a coach and each row of dots representing a range of 0.1 xGD. I’ve also labelled the coaches with the highest and lowest xGD per cluster, if that helps.

As is immediately obvious, the ‘Relentless’ grouping performs far better on average than any of the others, and I’d be surprised if that surprises anyone. As mentioned last time, this is the cluster which contains every Champions League semi-finalist from Europe’s big five leagues over the past four seasons, and it’s clearly not by chance that they all play a broadly similar style of high-pressing, ball-dominant football.
At the other end of the spectrum, we also get a clear indication of the general ineffectiveness of parking the bus and submitting to the opposition. While, as with David Moyes’ 20/21 West Ham, it’s not impossible to find some success in employing this style, there’s no hiding from the fact that a more adventurous approach tends to yield better results.
The natural response to this, though, is that it wouldn’t be particularly fair to sidle up to, say, Diego López (Brescia 19/20, -1.24 xGD), slam this graph down onto his desk, sending all his carefully laminated bus timetables flying in the process, and demand to know why he insisted on hanging out at the loser end of the chart rather than with Niko Kovač or Antonio Conte’s crew.
And it’s true - that wouldn’t feel particularly fair. If you’re not one of the lucky few blessed with a squad and transfer budget as luxurious as Man City’s or PSG’s, you can easily imagine feeling like you’ve no real choice but to fetch the shovels and get digging those trenches rather than trying in vain to take the handbrake off and go toe to toe with the superclubs. And I’ve got a graph for that, too.
To explore how clubs’ financial power impacts on a coach’s style of play and performance, I used data collected by Sporting Intelligence in their annual report on global sports salaries which details each club’s average wage per first-team player across Europe’s big five leagues. Unfortunately, their 20/21 report won’t be available for another six months or so as clubs only publish their financial records midway through the following campaign rather than each May. This means that, for the 20/21 season, I’ve been forced to rely upon estimates sourced from various websites, some of which will undoubtedly end up falling fairly wide of the mark. That said, I’m yet to spot anything within those estimated figures which differs too wildly from what you would expect given the legit data from previous seasons and the club’s stature. It’s far from perfect, and this will obviously be something to revisit once up-to-date information is released, but I’m reasonably happy with how it all adds up and that’s good enough for me - it’s just something definitely worth bearing in mind as we proceed.
So, with three seasons worth of official salary figures in one hand, and a list of my top 98 favourite numbers in the other, we’re almost set to go. Before we do, though, we need to quickly tidy up our numbers a little. We’re shortly going to delve into how finances impact upon a coach’s performance, which we’ll be judging based on those same xGD figures as used above. Seeing as our expected goals data relates solely to matches played in domestic league competition, it therefore follows that we should treat our wage bills in the same way - the extraordinary spending power of PSG in 2018/19, for example, would obviously be of little relevance when it comes to judging how good a job Chris Wilder did last season in relation to Sheffield United’s 2020/21 wage total.
Rather than using the raw numbers themselves, then, I’ve gone through and refigured the data so that every club’s salary bill is instead represented in terms of how many standard deviations it lies above or below the league average for that season, and those are the numbers we’ll use for the predictive model I’ll introduce in a minute. For ease of interpretation, though, I’ve also then transposed the data for each league and season onto a scale of 1 to 100. And I’ve called this the ‘Financial Power Rating’, because that sounds better than ‘Scaled Wages’ does. Here’s what it looks like:

Once again, the skyline is dominated by a towering, gold-plated monolith. The Relentless sector is home to so much cash that there wasn’t enough room on the top row to squeeze in all 20 coaches with a rating of 100 - Niko Kovač’s 18/19 Bayern have spilled over on to the second rung and sit alongside Pep Guardiola’s 99.88-rated Man City of 2017/18. Lack of space is similarly why a couple of clusters are missing a label for their minimum or maximum values where more than two coaches share a score of 1 or 100.
Formatting issues aside, the trend is pretty clear: most of European football’s wealth is being hoarded by clusters on the right hand side of the chart and, a couple of rogue José Mourinho’s aside, there’s relatively little to choose between the remaining five or six groups.
Next, let’s look at how those financial figures relate to the coaches’ xGD scores.

As the dotted line indicates, there is, unsurprisingly, a positive correlation between a club’s Financial Power Rating™ and the coach’s xGD results. As hinted at by the way the colours all start blending into one another, though, that’s the last we’ll see of that particular trend line.
In its place, I trained a slightly more complex linear regression model to judge the quality of each coach’s performance, allowing me to also take into account which league they’re competing in when calculating the predicted xGD value for a given financial rating. The difference between a coach’s actual xGD and the model’s league and wage-based prediction was then used to decide whether they performed above, below, or in line with expectation.
Once again, I’ve transposed the performance figures onto a scale of 1 to 100 for ease of interpretation. If I had access to more reliable financial data for last season, I would probably have left this number as it is and called it “goals above wage-expectation” or something, but I feel that’d be a bit of an overly confident leap considering where my numbers currently stand.

It turns out even our made up numbers can’t unseat the Relentless gang from the head of the table, but there does certainly look to be a greater balance to the scales this time around. That said, the point remains that coaches who try to play on the front foot are more likely to get the most out of their resources than those who elect to sit deep inside their own half - it’s just that trend isn’t quite as pronounced as you might expect.
The story is essentially the same when we look just at coaches with a below average financial rating, too:
Although the average performance score for the Relentless cluster shoots up by 8 points here, we have to caveat that with the fact that its population dropped from 84 to just 15 when we applied our financial rating filter - not an ideal sample size.
So, while hiring a stylistically more proactive coach by no means guarantees you success, then, it is definitely a safer bet than recruiting directly from the bus terminal - something of particular relevance right now with so many managers suddenly on the move. And on that note, for the benefit of any on-looking club directors or chairpeople, I’ve squished everything we’ve covered over these two articles into one interactive tool (link below), and thrown in a couple of new metrics for good measure.
To complement the eight clusters, I thought it’d be useful to try to describe each coach’s individual approach to the game too. So, again on a scale of 1 to 100, I’ve come up with four measures based on the data that went into the original cluster analysis.
** (Note: metrics marked with asterisks were counted negatively - i.e. the lower the value, the higher it scores in relation to the stylistic measures.) **
Control
Denotes how determined a coach is to keep hold of the ball, as well as how effective they are at doing so. The metrics used to calculate the score are:
Possession
Pass Completion %
% of Passes - Short (5 - 15 yards)
% of Touches - Midfield 3rd
(Opponent’s) PPDA (pressing intensity)
% of Passes - Medium (15 - 30 yards)
Aggression
Relates to the intensity with which a coach approaches regaining possession, and also takes into account stats hinting at how high they position their defensive line too. The metrics involved are:
** PPDA **
Loose Ball Recoveries per Opposition Pass
Fouls per Opposition Touch
** (Opponent’s) Pass Completion % **
(Opponent’s) % of Passes - Long (30+ yards)
Directness
Describes how eager a coach is to quickly move the ball into attacking areas, perhaps at the expense of a degree of control and safety in possession.
% of Passes - into Final 3rd
% of Passes - into Pen Area
% of Passes - Long
% of Passes - Progressive (10+ vertical yards in the opposition half)
% of Passes - Offside
(Opponent’s) Loose Ball Recoveries per Opp. Pass
** Pass Completion % **
** % of Touches - Mid 3rd **
Sitting
As you can guess, this measures a coach’s propensity to sit back and soak up pressure as opposed to adopting a more proactive, attacking approach.
% of Touches - Defensive 3rd
PPDA
(Opponent’s) Pass Completion %
(Opponent’s) % of Passes - Medium (15 - 30 yards)
** % of Touches - Final 3rd **
** Possession **
Here it is, then, an interactive tool for analysing and comparing coaches. It works and looks better in full screen and the mechanics are a little fiddly, but there you go. There’s plenty of filters to play around with, which could perhaps be useful in finding suitable candidates to take charge at a club for example, but to actually see the stats and ratings for a particular coach, you need to make sure to click their name either on the main map on the left or on the zoomed map inset on the right.
There we are. Go see if you can figure out why Real Madrid just poached Carlo Ancelotti from Everton. Or how José Mourinho’s managed to waltz his way into the Roma job - though I fear that may be exactly the kind of rabbit hole which will swallow you whole and forever seal you in.